You can create, edit, and manage saved forecasts in Breww to plan your future sales volumes. These forecasts can be made manually or created automatically using Breww's advanced machine learning algorithms. Once created, they can be used in the Stock availability forecast report to project when products might run out and when production or packaging will be needed.
You can manage your saved forecasts from either Products -> Tools & reports -> Sales forecasts or from the Stock availability forecast report by clicking Saved forecasts in the top-right corner.
Creating a new saved forecast
To create a new saved forecast, click New sales forecast in the top-right corner. Start with a name detailed enough that your team will know at a glance what it's for (e.g. 2026 Q1 Sales Plan). You can also add an optional description, for example, including the purpose of the forecast or how the numbers were forecast.
Adding the forecasted numbers
There are three ways to add your forecast: manually, by uploading a CSV/Excel spreadsheet, or by using Breww's automatic machine learning forecast.
Manually
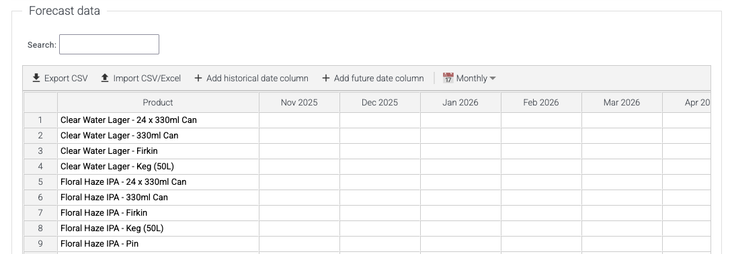
You can add your forecast directly to the on-screen Forecast data. To select the forecasting period, use the Monthly/Weekly drop-down to choose if this is a weekly or monthly forecast. You can then use the date range buttons, Add historical date column, and Add future date column to define your total forecasting period. Once that's done, simply enter your forecasted sales number for each product and time period.
Import from CSV
If you prefer to generate your forecast in Excel or another software, we recommend starting with our import template, which enables you to import your forecast back into Breww easily. To do this, define your forecasting period (Weekly or Monthly) and add the relevant periods, as if you were about to enter your figures manually. Then, export the template using the Export CSV button. This will generate a CSV file with Product ID and Product name columns, as well as a column for each time period in a format Breww's importer can understand. Once you've entered your forecast, simply import it back into Breww using the Import CSV/Excel button.
Automatic machine-learning forecast
Breww can use state-of-the-art machine learning to analyse your historical sales patterns and generate accurate forecasts. The model automatically learns:
- Your seasonal patterns and trends
- Product-specific demand variations
- Holiday and special period effects
- Your brewery's overall growth patterns.
To access the automatic forecasting tools, click the Show automatic forecasting options dropdown. The more historical data you have in Breww, the more accurate your forecasts will be. If you are new to Breww, Breww will highlight if you have less than two full years of sales data, and link you to Manage pre-Breww historical data, which you can read more about below.
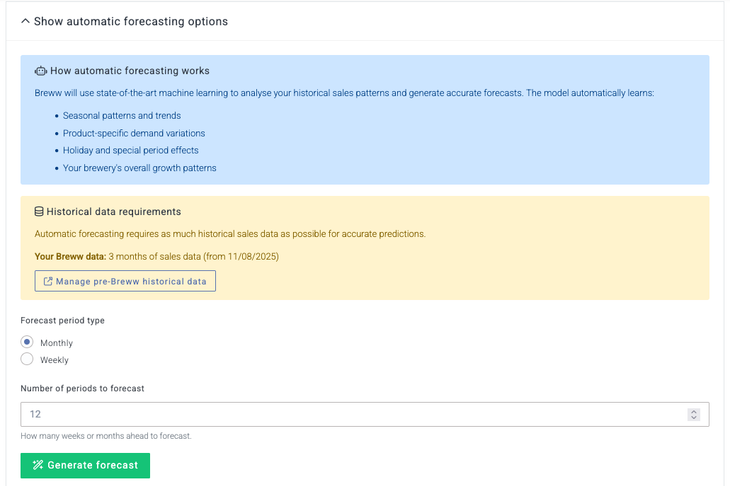
To generate your automatic sales forecast, just select the period type (Monthly or Weekly) and the number of periods you want to forecast and click Generate forecast. Breww will then populate the Forecast data grid, where you can review and make any adjustments you feel are necessary. For example, if you know you have an upcoming one-off event that hasn't appeared in your sales data before, you can adjust the forecast accordingly.
Note: A product requires sales on at least 30 distinct days to generate an automatic forecast. Products without sufficient sales history will appear in the forecast grid but without predicted values. You can still manually enter forecast numbers for these products.
Managing pre-Breww sales data for forecasting
It's easy to add your pre-Breww sales data to Breww, allowing you to start benefiting from advanced machine learning forecasting immediately. When creating a new sales forecast, click the Show automatic forecasting options dropdown and then select Manage pre-Breww historical data.
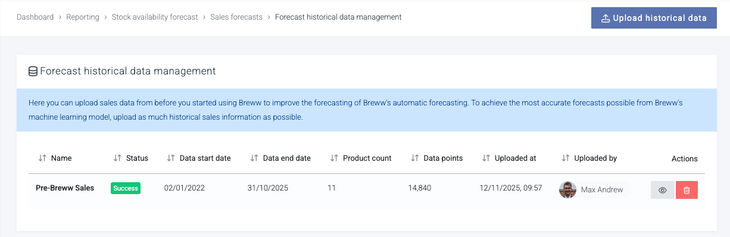
Here, you can upload basic sales data by clicking Upload historical data, to allow Breww to start making accurate forecasts immediately. You can upload a CSV or Excel file with the following headers: Product code, Product name, Date, Quantity. The product must exist in Breww to upload the historical data for it, and we recommend having a single row per product, date and quantity. Once uploaded, Breww will add this data to your existing Breww sales data when making any forecast.
Reviewing forecast accuracy
Once actual sales data is available for your forecast period, Breww automatically calculates how accurate your saved forecast was. You can access this by clicking Compare with actual from either the saved forecast list or the relevant forecast's page.
The comparison view shows:
- A side-by-side comparison table – Your forecasted quantities alongside actual sales for each product and period. Results are colour-coded: green for highly accurate (within 5% or two units), amber for moderate accuracy (within 20% or five units), and red for larger variances.
-
Comprehensive accuracy metrics – All metrics are volume-weighted, meaning larger containers (like kegs) have a greater impact than smallpack items:
-
Accuracy (%) – Overall forecast accuracy, with 100% being perfect. Based on WAPE (Weighted Absolute Percentage Error).
-
WAPE – Your average forecast error as a percentage of volume. Lower is better.
-
% Bias – Shows whether you consistently over-forecast (positive) or under-forecast (negative). Aim for close to 0%.
-
Total variance – The overall difference between your total forecasted volume and actual volume sold, shown as a percentage.
-
MAE (Mean Absolute Error) – Your typical forecast error per product/period in your chosen volume unit.
-
RMSE (Root Mean Square Error) – Similar to MAE but penalises larger errors more heavily. If the RMSE is significantly higher than the MAE, you have some products where the forecasts were substantially off.
-
Data points – The number of product × period combinations analysed.
-
Periods analysed – How many complete weeks or months have been analysed. Only fully completed periods are included to ensure fair comparisons.
-
The metrics help you understand not only whether your forecast was accurate, but also identify patterns, such as consistent over- or under-forecasting, which you can use to improve future predictions.
Viewing saved forecasts
When viewing a saved forecast, Breww displays all the products and their forecasted quantities. If a product has been deleted from Breww since the forecast was created, it will be automatically excluded from the display. This ensures forecasts remain usable even as your product catalogue evolves over time.
Editing or deleting saved forecasts
From the Saved forecasts list, you can:
- Click a forecast name to edit it.
- Use the delete button to remove old or test forecasts.
You can keep multiple forecasts (for example, "Baseline" and "Optimistic") and switch between them when running stock forecasts to see how it will affect your production schedule.