Breww's reporting suite is vast and provides the ability to pull together a huge range of data points. The reporting suite is split across three main areas; pre-built reports, aggregate data reporting and raw data reporting.
Pre-built reports
There are a number of reports to choose from split across three different categories; sales, production & inventory and deliveries. Pre-built reports cover an extensive range of data, such as COGS reporting, stock valuations, batch distribution and more.
Aggregate report builder
The custom aggregate data report builder allows reports to be configured across a number of metrics, timeframes and filters.
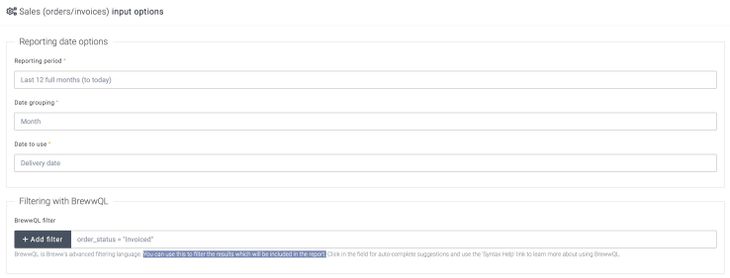
To create a report in the aggregate report builder, go to the Reporting tab and under the aggregate report builder, select the type of report required. Reporting timeframe options, as well as any further BrewwQL filters can be specified in the screen as per the below screenshot:
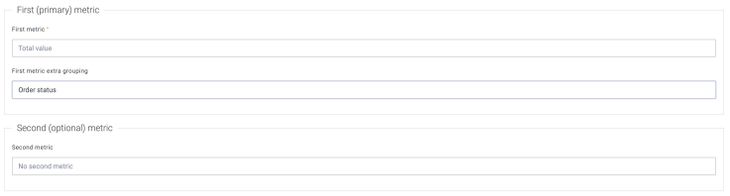
Primary reporting metrics then need to be specified. A primary metric is required to run the report, but a second, optional metric can be defined if required. Extra grouping options are available for each metric.
Custom reports can be saved for easy future access and can be scheduled to be delivered to you automatically by email. To schedule a report, firstly configure it as required (we recommend using relative dates, like 'last 12 months' instead of fixed specific dates on saved reports) and then save it for future access. Automatic delivery can then be automated on a user-defined schedule (e.g. every Monday morning), to your email address.

Raw data explorer
Start by choosing a dataset to report from (e.g. stock items, orders or products sold). Data fields can be added, removed and reordered to configure the report to your requirements. Data fields can also span across different datasets which are linked, such as "joining" from an invoice to the customer who received the invoice and then onto (for example), the customer group. BrewwQL filters can also be added to further filter which data will show.
Viewing raw data
By default, results are shown in a table form as individual rows rather than aggregated together. You can sort your results by using the sort configuration options. Raw data reports can be exported to Excel for further manipulation if needed.
Aggregating and grouping data
The Raw Data Explorer also supports powerful aggregation and grouping capabilities, allowing you to summarise your data directly within Breww.
To use aggregation:
-
Add the fields you want to include in your report
-
For fields you want to group by (e.g. customer name, product category), tick the Group by checkbox
-
For fields you want to calculate, select an Aggregation option from the dropdown
Available aggregation functions:
-
Sum - Adds up all values (numeric fields only)
-
Average - Calculates the mean value (numeric fields only)
-
Min - Shows the smallest value (numeric and date fields)
-
Max - Shows the largest value (numeric and date fields)
-
Count - Counts how many rows exist
-
Count distinct - Counts unique values only
-
Concatenate - Combines text values with commas (text fields only)
-
Any value - Shows one value from the group (text fields only)
The available aggregation options will vary based on the field type. For example, numeric fields like quantities and prices can be summed or averaged, while text fields can be concatenated or counted.
Example: To see total sales by customer, add the customer name field with Group by ticked, and the order total field with Sum selected as the aggregation.

Sorting results
You can sort your report results by selecting fields in the sort configuration section and choosing Ascending (smallest first) or Descending (largest first). It's possible to sort by multiple fields, such as to sort a list of invoices by date first and then by value. Sorting works with both raw data and aggregated results.

This tool provides access to all core data in your account. If there's a dataset that you can't access, but would like to, please feel free to request it to be added. As with the aggregate report builder, these reports can also be saved for easy future access.
You're safe to play around with the options and try different things out in the Reporting area without risking changing any of the underlying data, the only exception to this is the Stock Take function.
As with the aggregate report builder, you can use BrewwQL to filter what results will show in your report. You can then save the report for easy future access. Once that's been done the report will be listed (with your chosen name) in the "Reporting" section of Breww.
Exporting reports
Exporting pre-built reports:
Once a 'pre-built' report has been run, you will be able to export this via either the Export to Excel or Export to CSV button on the top right of the page.
Exporting Aggregate data reports:
Aggregate data reports can be exported via the Export to Excel button towards the bottom of the page.
Exporting Raw data explorer reports:
Raw data explorer reports can be exported by changing the Output option under Data to extract to Export to Excel and then selecting Explore data.
Sharing Raw data explorer reports using "Share codes"
A share code allows you to share the "settings" for a Raw Data Explorer report with others (such as the fields to include and the filters to apply). They don't share the data itself, so they can be shared between different breweries and safely posted publicly on the Breww Community. Please see the dedicated guide: Reporting share codes.